Prediction Markets Beat Professional Forecasters
July 21, 2026
The research on whether these prediction markets are accurate and what it costs to trade them is more interesting than either the industry's pitch or its critics allow.
The case for prediction markets rests on a single claim: that a price set by people with money at risk is a better probability estimate than a poll, a pundit, or a professional forecaster.
That claim is now testable at scale, and the answer is genuinely split. On macroeconomic contracts, prediction markets match or beat professional economists. On long shots — the cheap contracts where retail money concentrates — they are wrong in a specific, measurable, and consistently profitable-to-exploit direction.
If you trade these markets, the second finding is the one that costs you money.
The good news first
A Federal Reserve Finance and Economics Discussion Series paper by Diercks, Katz and Wright (2026) found that Kalshi's macroeconomic prediction markets perform comparably to, and in some cases better than, traditional economist surveys and financial derivatives.
Academic work on Kalshi's unemployment markets found a Brier score of 0.1106 across 287 contracts — a 55.8% improvement over random guessing. A separate study of 2,668 settled Kalshi macroeconomic contracts spanning July 2021 to June 2026 found Federal Reserve and interest rate markets to be the most predictable category, with no detectable long-shot bias at all.
And a working paper by Karl Whelan and co-authors at University College Dublin, analysing over 300,000 Kalshi contracts, confirms the basic mechanism works: contract prices are informative, and they get more accurate as markets approach closing.
That is a real result. The wisdom-of-crowds claim survives contact with the data.
The bad news
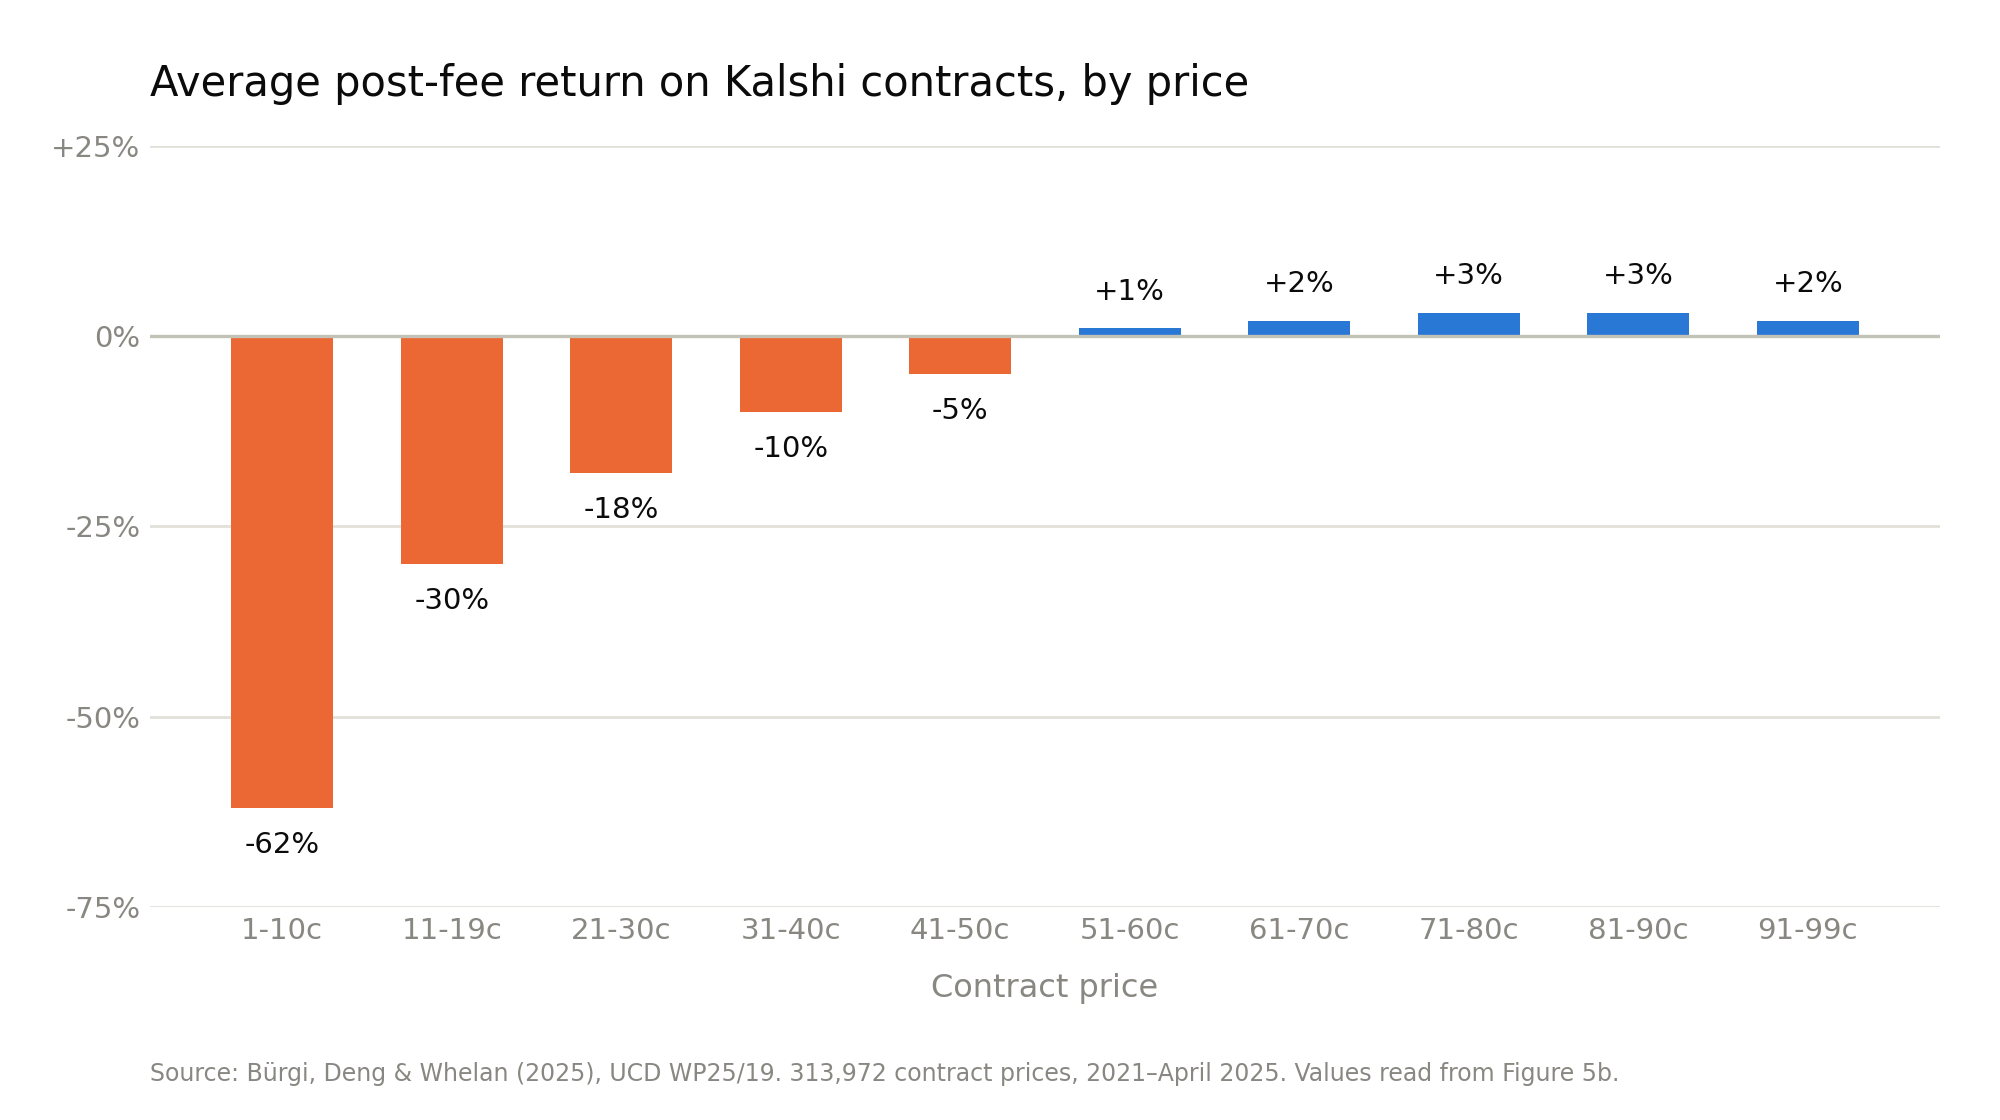
The same UCD paper finds that Kalshi's prices display a clear favourite–longshot bias: low-price contracts win far less often than required to break even after fees, while high-price contracts win more often and yield small positive returns.
The bias was first documented by Griffith in 1949, in horse racing. Favourites are underpriced; long shots are overpriced. What is new is finding it in short-dated prediction markets, where it had not previously been recorded.
The UCD authors go further using Kalshi's transaction-level data, which records which side of each trade was the taker. The bias appears for contracts bought by both makers and takers, but is more pronounced for prices accepted by takers — consistent with a model in which market makers seek modest returns but are slightly too optimistic about their own chances.
An arXiv study of calibration dynamics across both platforms found the same pattern at what it called unprecedented scale: at long horizons, favourites are systematically underpriced and long shots overpriced. It persists even when the sample is restricted to high-volume markets. Political underconfidence replicates on both Kalshi and Polymarket.
Its conclusion is the sentence every reader of these prices should internalise: consumers who treat prediction market prices as face-value probabilities will systematically misinterpret them, and the direction of the misinterpretation depends on what is being predicted, when, and by whom.
Check out Kalshi API
Read More: Prediction market API guide | How odds aggregation works
Both platforms publish public APIs, which is why prediction market API data has become unusually easy to scrutinise: Kalshi's is free to access with no subscription or per-request charges, and Polymarket's CLOB historical trade data is rich enough to run proper calibration studies. That transparency is why the academic literature on these markets has grown so fast — and why nearly every volume figure in circulation traces back to the same handful of Dune dashboards
The bias is not uniform
Category matters enormously, and this is where the research becomes practically useful.
The 2,668-contract macro study found long-shot bias present in inflation and employment markets but absent in Fed and interest rate markets. Unemployment markets showed the largest negative bias, at −0.0891.
The dedicated unemployment paper quantifies it precisely: contracts priced below $0.30 carry a statistically significant negative bias of −0.077 against an actual win rate of just 4.0%. Favourites in the same markets were well calibrated, with a bias of −0.028 that was not statistically significant.
Read that again. In unemployment markets, contracts priced below 30 cents won 4% of the time.
Why this connects to the loss data
Researchers at the University of Toronto, HEC Montréal and ESSEC Business School, led by finance researcher Pat Akey, examined 2.4 million Polymarket users and $67 billion in trading volume from November 2022 through March 2026.
They found that 68.8% of users lost money. The top 1% of traders captured 76.5% of all gains; the top 0.1% alone accounted for more than half of total profits.
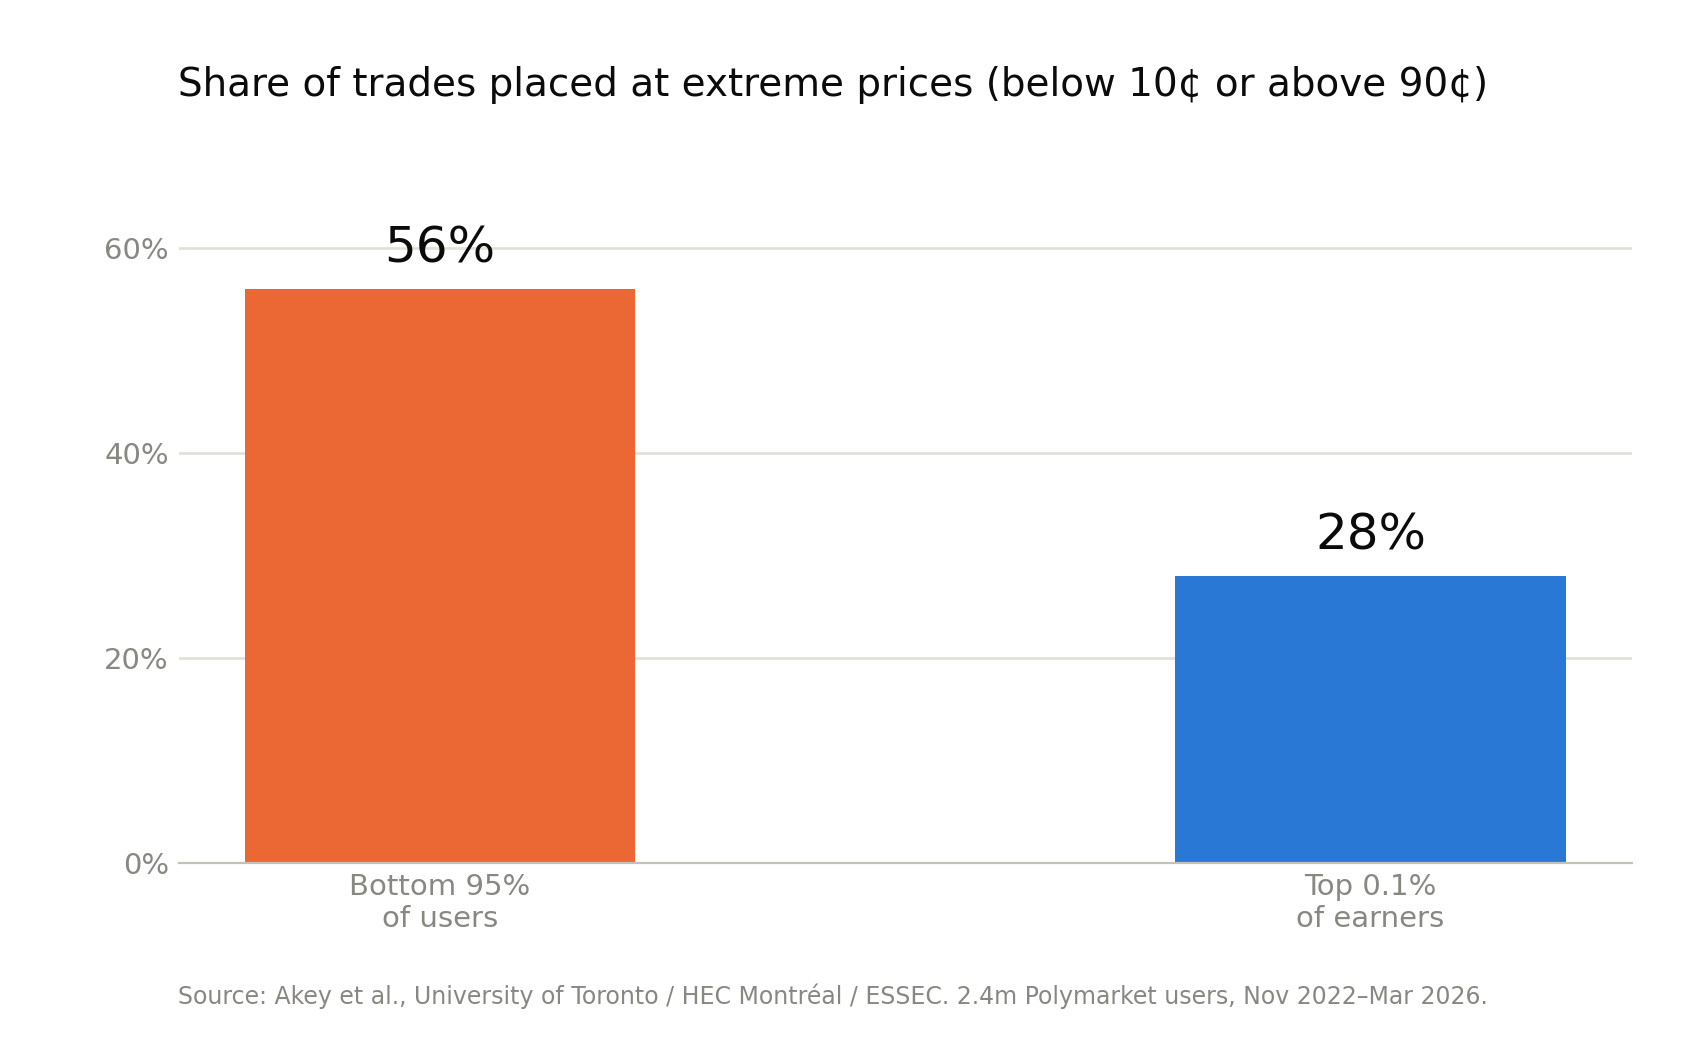
The mechanism they identified is the important part. Users who lose money trade considerably more often at extreme prices — below 10 cents or above 90 cents. The bottom 95% of users place 56% of their trades at those prices, against 28% for the top 0.1% of earners.
That is the calibration research and the profitability research describing the same phenomenon from opposite ends. Long shots are mispriced. Losing traders buy long shots.
The authors add an appropriate caveat: they urge caution in reading their findings as evidence of skill or information, since they lack the tools normally used to assess performance in financial markets.
A Wall Street Journal analysis reached the same shape by a different route. Reviewing 1.6 million accounts active since November 2022, out of at least 2.3 million total, it found 0.1% of accounts captured 67% of all profits — fewer than 2,000 accounts netting nearly $500 million. More than 1.1 million of the accounts studied were unprofitable. The typical user is down between $1 and $100; the bottom 10% have lost an average of $4,000 each.
On Kalshi's mention markets — contracts on whether a public figure will say a specific word on air — the Journal analysed more than 35,000 markets and found average "yes" bettors lose 11% of what they wager, worse than most Las Vegas slot machines.
The industry's answer
Kalshi does not dispute the pattern. Spokeswoman Elisabeth Diana told the Journal there are 2.9 unprofitable users for every profitable one based on the past month's data, arguing that wealth concentration is common across financial markets and that more Kalshi users make money than day traders or sports bettors do on traditional platforms.
Adhi Rajaprabhakaran, a former Kalshi employee who once described casual traders as "fish," told the Journal that the presence of uninformed traders is a powerful incentive for sophisticated traders to enter, which results in more accurate forecasts. Everyone thinks they're the more informed trader when they place a trade, he noted, and no one is being forced to do this.
That framing — retail losses as the fee that funds price discovery — is mathematically coherent and morally contested.
There is also a fair statistical objection to treating these numbers as damning. They describe a general property of retail speculation venues, not something unique to prediction markets. Some 1.3% of daily fantasy sports players took 91% of profits in 2015. Of Brazilian retail futures traders who persisted past 300 days, 97% lost money. Retail equity options traders lose 5% to 9% per earnings-announcement trade. A Washington Post analysis concluded that Polymarket users lost at roughly the same rate as British online sports bettors.
The loss distribution is not evidence that prediction markets are uniquely predatory. It is evidence that they behave like every other venue where retail money meets professional money.
What it costs to trade
The industry has no standard fee structure. Total costs range from 0.01% to over 15% depending on platform — a difference of more than 1,000x between cheapest and most expensive.
Kalshi charges per-contract trading fees of roughly $0.07 per round trip, varying by contract price and maker/taker status, plus a settlement fee. ACH deposits and withdrawals are free, but take one to three business days, and new deposits can face security holds of 3 to 30 days — which can lock capital during exactly the fast-moving markets you wanted it for.
Polymarket charges 0% taker fees on its international platform, with costs limited to Polygon gas of typically fractions of a cent. Polymarket US uses a flat 0.10% taker fee on total contract premium and 0% maker fee. The platform has recently introduced 15-minute taker fees.
PredictIt charges 10% on profits plus 5% on withdrawals, which compound to significantly reduce effective returns.
Robinhood's zero-commission model looks cheapest of all, but the platform earns revenue through payment for order flow and wider bid-ask spreads. All-in cost may be similar.
The number that actually matters
Stated fees are the least important cost on this list.
A "0% fee" market with a five-cent spread costs more than a "2% fee" market with penny-wide quotes. On Polymarket, costs are embedded in the bid-ask spread rather than charged explicitly — which is not the same thing as being free.
On the highest-volume markets, both major platforms run one-to-two-cent spreads. Polymarket tends to be tighter on crypto-native and political contracts; Kalshi tends to be tighter on US sports and macro markets. Away from those headline markets, niche contracts carry thin liquidity, wider spreads, and position caps that make orders hard to fill or size.
Then the hidden costs. On Polymarket: 1–3% to buy USDC via card or exchange, another 0.5–1% to convert back to dollars, plus bridge fees if your USDC sits on Ethereum mainnet, where gas can spike above $20 during volatility. On Kalshi: none of that, since it is pure USD — but slower funding.
Net position for most retail traders: all-in costs are roughly comparable. Kalshi is simpler and more tax-friendly. Polymarket is cheaper for active traders who keep funds on the platform.
On tax: net profits are taxable as ordinary income federally. Kalshi issues a 1099-MISC once annual net winnings pass $600. On Polymarket, you export a CSV of on-chain trades and calculate the gain yourself.
You might also like: Polymarket, Kalshi & Aggregator APIs: Advanced Developer Guide
One distinction worth keeping straight
A market can have poor calibration and still pick the eventual winner most of the time. That is resolution, not calibration, and conflating the two is one of the most common errors in reading a price chart.
"The market called it right" and "the market's 78% was actually 78%" are different claims. Only the second one is what makes a prediction market useful as a forecasting instrument — and only the second one determines whether the price you paid was fair.
Sources: Whelan et al., "Makers and Takers: The Economics of the Kalshi Prediction Market" (UCD working paper WP2025_19, summarised at CEPR/VoxEU); Akey et al. (University of Toronto, HEC Montréal, ESSEC Business School); Diercks, Katz and Wright, Federal Reserve Finance and Economics Discussion Series (2026); arXiv 2602.19520 on domain-specific calibration dynamics; ResearchGate publications on Kalshi macroeconomic and unemployment market efficiency; Wall Street Journal; Bloomberg; Washington Post; Dune Analytics; DeFi Rate.
Note: fee figures are drawn substantially from commercial comparison sites, several of which carry affiliate relationships with the platforms they cover. Verify specific numbers against Kalshi's published fee schedule and Polymarket's documentation before acting on them.
Ready to get started?
Free tier. Query prediction-market prices alongside sportsbook odds.